

Measuring Marketing Automation Impact Honestly
Open rates and attributed revenue tell you activity happened, not that it changed anything. Holdouts and baselines tell you what the automation actually caused.

A welcome journey goes live and the dashboard shows that customers who received it spent more. The journey gets the credit. But those customers had just signed up and were already likely to buy. Without a comparison group, nobody can say how much of that spending the journey caused and how much would have happened anyway.
Honest measurement is about separating the two. It is not hard to set up, but it has to be designed before launch, not reconstructed afterwards.
Activity, attribution and incrementality
These three are often reported as if they were the same thing.
- Activity metrics (sends, opens, clicks) show that the automation ran and people engaged with it. They are useful for operations and diagnosis. Opens in particular have become less reliable because some mail clients load images automatically, so treat them as a rough signal.
- Attribution assigns credit for a conversion to touchpoints, using rules such as last touch or multi-touch. It answers "which touches were present before conversion?" Campaign influence in Salesforce works this way. It does not answer what would have happened without the touch.
- Incrementality compares people who received the automation with similar people who did not. The difference is the effect the automation caused. This is the number that should drive investment decisions.
All three have a place. The problem is presenting attribution or activity as if it were incrementality.
Holdout groups
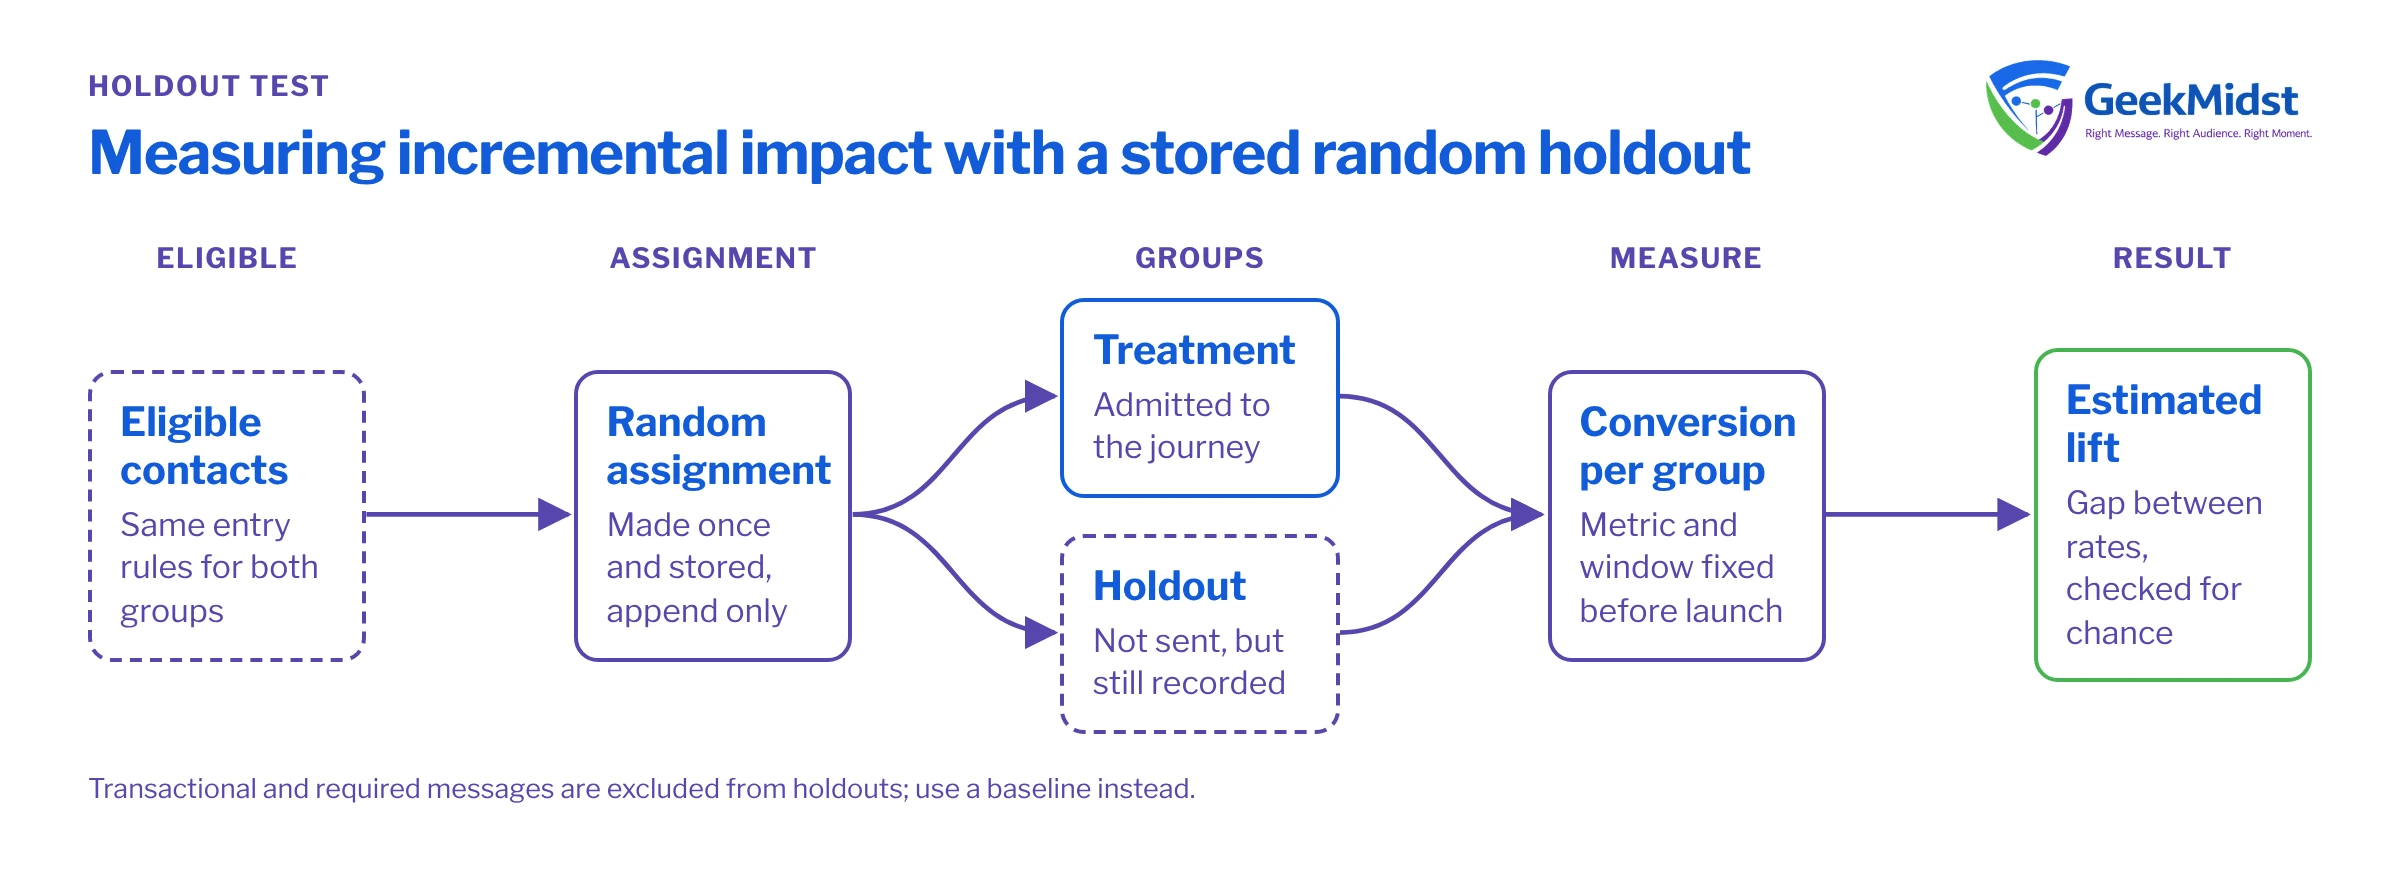
The most practical way to measure incrementality in a marketing platform is a holdout: a randomly selected share of eligible people who are deliberately not sent the automation. Because selection is random, the holdout and treatment groups should behave the same apart from the automation. Compare their conversion rates over a fixed window and the difference is your estimate of the effect.
Three things make a holdout trustworthy:
- Random assignment made once and stored, so a person stays in the same group for the whole test.
- The same eligibility rules for both groups. The holdout must be people who would have entered the journey.
- A fixed measurement window and metric agreed before launch, so nobody chooses the flattering one afterwards.
Before you start
The examples below are sample Marketing Cloud SQL for Query Activities. They assume a data extension Welcome_Eligible_DE with a SubscriberKey field, populated by your entry logic; a stored assignment data extension Holdout_Assignment_DE with SubscriberKey (primary key), TestGroup and AssignedDate; and an Orders_DE with SubscriberKey and OrderDate. Adapt names and test in a non-production business unit first.
SELECT
    e.SubscriberKey,
    CASE
        WHEN ROW_NUMBER() OVER (ORDER BY NEWID()) % 10 = 0 THEN 'Holdout'
        ELSE 'Treatment'
    END AS TestGroup,
    GETDATE() AS AssignedDate
FROM Welcome_Eligible_DE e
WHERE NOT EXISTS (
    SELECT 1
    FROM Holdout_Assignment_DE h
    WHERE h.SubscriberKey = e.SubscriberKey
)The journey's entry source or an entry filter then admits only contacts whose TestGroup is Treatment. Holdout contacts are still recorded, so you can compare them later. Once the measurement window has passed, a second query counts conversions per group.
SELECT
    h.TestGroup,
    COUNT(DISTINCT h.SubscriberKey) AS Contacts,
    COUNT(DISTINCT o.SubscriberKey) AS Converters
FROM Holdout_Assignment_DE h
LEFT JOIN Orders_DE o
    ON o.SubscriberKey = h.SubscriberKey
   AND o.OrderDate >= h.AssignedDate
   AND o.OrderDate < DATEADD(day, 30, h.AssignedDate)
WHERE h.AssignedDate < DATEADD(day, -30, GETDATE())
GROUP BY h.TestGroupDivide converters by contacts for each group. The gap between the two rates is the estimated lift. Before reporting it, check whether the gap is larger than you would expect from chance; a standard two-proportion test or a confidence interval will tell you, and your analytics team or any statistics package can run it.
Baselines when a holdout is not possible
Some messages should never be held out: transactional emails, service notices, anything legally or contractually required. For those, and for changes where a holdout is impractical, use a baseline: measure the metric for a stable period before the change, then compare after. Baselines are weaker because other things change at the same time (seasonality, pricing, a sales campaign), so record what else happened and present the result as indicative.
Mistakes that inflate results
- Comparing engagers with non-engagers. People who click are different from people who do not, regardless of the email. This comparison always looks good and proves very little.
- Holdouts that differ from the treatment group. If the holdout is "people we could not email", it is not a holdout. It is a different population.
- Moving the goalposts. Changing the metric, window or audience after seeing results. Write the plan down before launch.
- Stopping early. Checking daily and stopping the test the first time the gap looks big. Agree the duration in advance.
- Counting the same conversion twice. If three automations each claim the same order through last-touch attribution, the totals add up to more than actual revenue.
- Ignoring sample size. A small journey may never produce enough conversions to detect a modest effect. That is worth knowing before you build an elaborate test.
Measurement checklist
- Primary metric, window and audience written down before launch.
- Random holdout assigned once and stored, with the same eligibility as treatment.
- Holdout excluded from the journey but kept for reporting.
- Transactional and required messages excluded from holdouts.
- Results reported with a significance check and the period's other changes noted.
- Attribution and activity reported as context, not as proof of impact.
Related reading
Want measurement you can defend?
GeekMidst can design holdout tests and reporting for your journeys, build the queries and data extensions, and help you present results without overclaiming.


